Historical Report of Service Tickets by Date in ConnectWise
Clients often ask me if there’s a way to build a report that looks back on service board statistics over time. While some more complex questions will require either building your own historical database or paying for a 3rd party tool like Cognition 360 to do it for you, we can do quite a lot with just a quick SQL query. This won’t work in Report Writer without SQL write access but if you are self-hosted or have the cloud SQL add-on, this will work in your reporting tool of choice.
The code below shows total tickets open, average age, and SLA stats over time. There is also a commented out section that pulls in a custom field value. I left that on for folks that would like to add their own custom field to this.
You can modify the select statement below to look at other info from the v_rpt_service view. Keep in mind that this is not a true historical report so if you’re looking at a certain value and it has changed since the date of ticket closure, you’ll only see the value as of now.d
The Query
SELECT
	d.Date
	,d.DateKey
	,COUNT(SR_Service_Recid)  Total_Open
	,AVG(ISNULL(s.Closed_Age,s.Age)) Avg_Age
	--,SUM(CASE WHEN s.LatestRating = 'Red' THEN 1 ELSE 0 END) As Rating_Red
	,AVG(s.Resplan_Minutes) As Avg_Resplan_Minutes
	,AVG(s.Responded_Skipped_Minutes) As Avg_Responded_Skipped_Minutes

FROM
	Date_Dimension d
INNER JOIN
	(SELECT
			ss.*
			--,scf.LatestRating
		FROM
			v_rpt_Service_Summary ss
		--LEFT JOIN v_SR_Service_Custom_Fields scf ON scf.SR_Service_RecID = ss.SR_Service_RecID
		WHERE
			ss.Board_Name = 'Help Desk'
			AND ss.Parent IS NULL
	) s ON CONVERT(date,s.date_entered) <= d.date --For each date, include only tickets entered before and ....
		AND ISNULL(CONVERT(date,s.date_closed),CONVERT(date,getdate())) >= d.date   ---....not yet closed

--WHERE d.Date <= getdate() AND d.date > getdate() -365  --Change number here to adjust number of days to look back

GROUP BY
d.Date
,d.DateKey

--ORDER BY d.Date
The Results
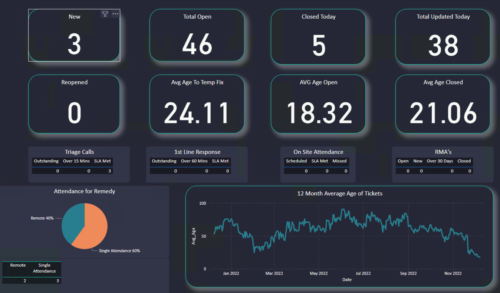
Below is a Power BI dashboard I used the query in. The 12 Month Average Age of Tickets visual on the bottom right shows the trend over time.

Were you able to use this SQL query in a report? Feel free to reply below in the comments!
Want to do more?
Contact us for one-on-one help or connect with us on the ConnectWise subreddit or the ConnectWise University Forums.